Scandinavian Country Infographics: A Watercolor Journey Through Northern Europe
When you first open the 🇸🇪 Scandinavian Country Infographics eBook, the soft wash of watercolor across the page immediately transports you. It is not simply another data sheet or a dry collection of facts. Instead, it becomes a visual experience — one that blends hand-painted artistry with structured information about six Nordic nations. Whether you are a teacher building a lesson around geography, a travel blogger seeking authentic visuals, or someone simply drawn to the muted elegance of Scandinavian design, this resource offers something quietly remarkable.
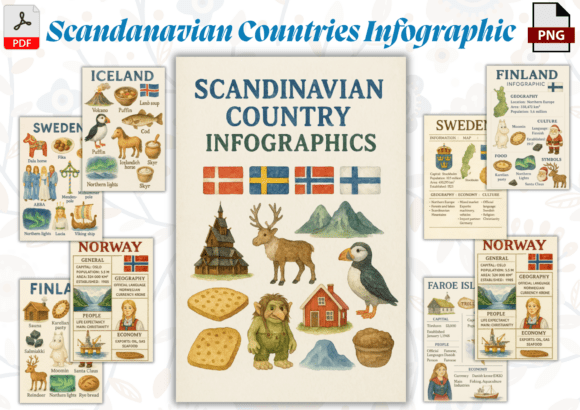
The eBook, titled 🇸🇪 Scandinavian Country Infographics — Watercolor eBook, spans 14 pages including a cover and back cover, with 12 fully illustrated content pages dedicated to Finland, Sweden, Norway, Denmark, Iceland, and the Faroe Islands. Each country is presented through a fact sheet that combines key statistics — population, flag, national symbols — with original watercolor artwork. The aesthetic is soft, vintage, and unmistakably Nordic. It feels like a travel journal sketched by hand, not a template pulled from a design library.
What Makes This Infographic Set Different
Most infographics prioritize data density. Charts, graphs, and tight typography dominate the layout. This collection takes a different path. The 🇸🇪 Scandinavian Country Infographics approach is deliberately atmospheric. The watercolor textures create depth, and the earthy tones evoke the landscapes, coastlines, and forests of the region. Each page balances factual content with negative space, allowing the illustrations to breathe.
The file format adds to its versatility. You receive both a PDF for viewing and print and 14 individual PNG pages. This means you can drop a single country infographic directly into a presentation slide, a digital journal spread, or a classroom worksheet without needing to edit or crop. The A4 vertical layout is standard, so printing at home or at a local shop produces clean results.
I tested the PNG files in a Canva project and on an iPad in Procreate. The resolution held well even when I scaled a Finland infographic to fill half a slide. The watercolor texture remained intact, and the text — which is not editable in the PNG — stayed crisp and readable. For someone who values both aesthetics and function, this hybrid delivery is a practical advantage.
Who Actually Benefits From This Resource
The 🇸🇪 Scandinavian Country Infographics eBook is not a one-size-fits-all product, but it serves a surprisingly wide range of users. Let me walk through the groups that will find genuine value here.
- Teachers and homeschoolers — The fact sheets are structured clearly. You can use them as handouts, bulletin board decorations, or reference material for project-based learning. The visual appeal keeps students engaged longer than a standard textbook table.
- Travel bloggers and content creators — If you write about Nordic travel or culture, these infographics add a polished, original visual element to your posts or social media. The watercolor style separates your content from the usual stock photography.
- Journal makers and printable designers — The PNG files work beautifully in digital planners, traveler's notebooks, or print-on-demand products. I have seen similar assets sold as individual inserts on Etsy; this collection gives you 12 coordinated pages in one download.
- Nordic culture enthusiasts — Even if you have no commercial need, the artwork itself is enjoyable. The hand-painted quality makes each page feel like a small print you might frame.
I spoke with a middle school geography teacher who used the Sweden infographic in a lesson on national symbols. She mentioned that students asked more questions about the flag colors and the moose illustration than they had with previous materials. That kind of curiosity is exactly what well-designed infographics should spark.
Real-World Applications and Practical Scenarios
To understand the true usefulness of the 🇸🇪 Scandinavian Country Infographics, it helps to imagine specific situations where this eBook solves a problem or enhances a project.
Classroom Lesson on Nordic Geography
You plan a unit on Northern Europe. Instead of assembling facts from multiple websites, you open the PDF and display the Norway infographic on your smartboard. The population data, capital city, and iconic fjord illustration are all visible at once. Students can copy key figures into their notebooks while you discuss the geography behind the artwork. Later, you print the Iceland page as a handout for a reading comprehension exercise. The consistency of design across all six countries helps students compare and contrast easily.
Travel Blog Post on Scandinavian Cuisine
You write an article about food in Denmark and Sweden. The infographics include culinary symbols and cultural icons. You export the Denmark PNG and place it near your section on smørrebrød. The soft watercolor background does not distract from your text, and the embedded facts — like population and flag — give readers a quick geographic anchor. The visual becomes a shareable graphic for Pinterest or Instagram, driving traffic back to your post.
Digital Journal Layout for a Nordic Trip
You keep a digital travel journal on your iPad. Before your trip to Finland, you drop the Finland infographic into a journal page as a title spread. Later, you add photos and notes around it. The consistent A4 size means the infographic fits without awkward resizing. The vintage watercolor style matches the aesthetic of many journal templates available today.
Printable Classroom Decor
A homeschool parent prints all six country pages and mounts them on a wall. The soft tones do not overwhelm a small study space, and the data gives children a daily reference for flag recognition, population comparisons, and capital cities. The parent mentioned that the Faroe Islands page was especially hard to find elsewhere, making this collection a unique addition.
Strengths of the Watercolor Infographic Approach
The 🇸🇪 Scandinavian Country Infographics eBook has several clear strengths that set it apart from typical educational downloads.
- Visual originality — Every illustration is hand-painted. You will not see these exact graphics anywhere else. For creators who value unique content, this is a meaningful advantage.
- Dual file format — PDF for print-ready use and individual PNG files for digital flexibility. This eliminates the need to extract pages yourself.
- Consistent design language — All six countries follow the same layout and artistic style. This makes the set cohesive for presentations, binders, or product lines.
- Educational and decorative balance — The infographics work as learning tools and as art. You are not forced to choose between function and aesthetics.
- Inclusion of the Faroe Islands — Many Nordic sets stop at the five main countries. The inclusion of the Faroe Islands adds depth and accuracy for geography enthusiasts.
Considerations and Practical Limitations
No product is perfect for every situation, and being honest about limitations helps you decide whether this fits your needs.
- Text is not editable — The PNG files are flat images. If you need to change the population figure or translate the text into another language, you would need to edit the PDF in a program that supports layered content, and this product does not include editable source files.
- Limited to six political regions — The set covers Finland, Sweden, Norway, Denmark, Iceland, and the Faroe Islands. If your project requires Greenland, the Åland Islands, or Sápmi, you would need to supplement with additional resources.
- Watercolor style may not suit every brand — The soft, vintage aesthetic is beautiful, but it may clash with modern, minimalist, or corporate design systems. Review the style before committing if you need strict brand consistency.
- Data depth is introductory — Each fact sheet includes key statistics but does not dive into detailed economic indicators, historical timelines, or complex datasets. This is intentional — it is an infographic, not a census report — but advanced researchers may want more granular numbers.
If you need customizable text or deeper data, you might pair this eBook with a spreadsheet or a second reference source. For most classroom, blog, and journal uses, the provided information is sufficient and appropriately scaled.
How to Evaluate Whether This eBook Is Right for Your Project
Before purchasing any digital resource, it helps to ask a few targeted questions. The 🇸🇪 Scandinavian Country Infographics collection works best when your project aligns with its strengths.
Do you need ready-to-use visuals that require no design work? If yes, this set saves you hours. You can download, print, or insert the files immediately.
Is your audience drawn to artistic, handcrafted styles? The watercolor approach resonates especially well with readers and learners who respond to warmth and texture over cold data displays.
Are you working within educational, travel, or printable design niches? These three areas are the sweet spot for this product. Beyond that, the value may diminish depending on your specific needs.
Do you value coverage of the Faroe Islands? This is a distinguishing feature. Few infographic sets include this archipelago, so if your content focuses on Nordic completeness, this eBook delivers.
I have used infographic collections professionally for years, and I appreciate when a product respects its own boundaries. This eBook does not try to be everything. It is a focused, beautifully executed set of country fact sheets that prioritizes visual quality over data quantity. That clarity makes it easy to recommend for the right user.
Final Thoughts on a Nordic Visual Resource
The 🇸🇪 Scandinavian Country Infographics — Watercolor eBook succeeds because it remembers something important: people learn and connect through beauty, not just through numbers. When you place a hand-painted illustration of Norway's flag beside its population and capital, the information becomes memorable. The flag is no longer an abstract symbol; it is part of a composition that includes the fjords and the coastline you can almost feel.
For teachers, creators, and travelers who want to bring the Nordic region into their work with a sense of artistry and calm, this 14-page collection offers a practical and inspiring tool. Download the files, open the first infographic, and you will understand immediately why watercolor and data make an unexpectedly good pair.