Wave Data Infographic Timeline: Visual Storytelling Made Simple
A timeline is one of the most effective ways to show progress, explain a process, or highlight key milestones. But not all timelines are created equal. The Wave Data Infographic Timeline brings something fresh to the table—a blend of clean layout, bold gradients, and fluid wave elements that turn a straightforward chart into a visual experience. Whether you’re mapping out a project plan, walking through a case study, or laying out a strategic roadmap, this template helps you communicate clearly while keeping your audience engaged.
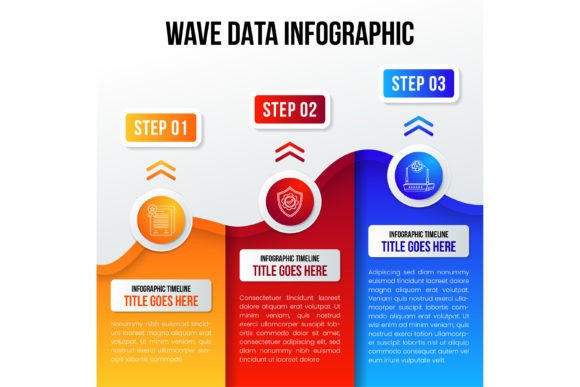
At first glance, the design stands out because of its three-step structure. Each step is anchored by a circle-shaped icon, connected by a flowing wave pattern that uses red, yellow, and blue gradients. The wave element isn’t just decorative—it guides the eye naturally from left to right (or top to bottom, depending on your layout). The overall composition feels balanced, modern, and purposeful. It avoids clutter while still feeling dynamic, which is a hard balance to strike.
What Makes the Wave Data Infographic Timeline Stand Out
The visual personality of this template is best described as confident and approachable. The gradient wave elements add a sense of movement and energy, making the timeline feel alive rather than static. The red, yellow, and blue color palette is bold without being overwhelming—each color stands out on its own, but together they create a cohesive look that works well for both digital and print applications.
One of the strongest aspects of this template is its versatility. The square layout design makes it easy to insert into presentations, reports, or social media graphics without having to resize or reformat everything. And because all graphics are 100% vector, you can scale the design up or down without losing quality. That’s especially useful if you’re creating both a web version and a printed handout from the same source file.
The inclusion of editable text, shapes, and colors means you’re not locked into a preset style. Want to swap the red for a deep teal to match your brand identity? Go ahead. Need to change the icon shapes? That’s straightforward too. This level of flexibility is what separates a premium design asset from a one-size-fits-all template.
Where the Template Shines Across Creative and Commercial Projects
This infographic template is great for a wide range of projects. In marketing, it works well for campaign timelines, product launch roadmaps, or customer journey maps. The three-step structure is especially effective for explaining a simple process—like how a service works or what a customer can expect after signing up. Because the layout is minimal and uncluttered, it keeps the focus on the message rather than the design itself.
In editorial and publishing contexts, this template can be used to illustrate a case study or a historical overview. The gradient wave elements add a modern touch that fits well with contemporary editorial styles. Bloggers and content creators will find it useful for breaking down a complex topic into digestible steps—think “How to Start a Blog in 3 Steps” or “The 3 Phases of a Successful Content Strategy.”
For small business owners and entrepreneurs, this template is a practical tool for investor pitches, team presentations, or internal planning documents. The clean design conveys professionalism without feeling cold or corporate. It invites the viewer in, which is exactly what you want when you’re explaining your business model or growth strategy.
Web designers and digital creators can also repurpose elements from this template for website infographics, email newsletter visuals, or social media carousels. The high resolution (300 dpi) and vector format make it easy to adapt for different screen sizes and resolutions. And because the file includes Ai, EPS, JPG, and SVG formats, you can work in whichever application fits your workflow best.
How Visual Hierarchy and Readability Benefit from This Layout
Good design is about guiding the viewer’s attention, and this template does that well. The circular icons act as anchor points—each one draws the eye and signals that something important is happening at that step. The wave element connects these points visually, creating a clear path from start to finish. This natural flow helps viewers process information in the intended order, which is critical for timelines and step-by-step explanations.
The use of gradient colors adds depth without complicating the layout. The red, yellow, and blue waves create a visual rhythm that keeps the viewer engaged. Because the colors transition smoothly, they don’t compete with the text or icons for attention. Instead, they support the overall message by adding visual interest to what might otherwise be a simple list of steps.
Text readability is also well-supported. The layout leaves enough white space around each step so that labels, descriptions, and numbers remain easy to read. The circle shapes provide a natural container for icons or numbers, which helps organize information neatly. If you choose to add additional text, the template’s structure ensures that the content remains scannable—a key factor for audience engagement in both presentations and published materials.
From a brand perception standpoint, using a polished, modern infographic template signals that you care about how your message is received. It reflects professionalism and attention to detail. When your audience sees a well-designed timeline, they’re more likely to trust the information you’re presenting. That’s a subtle but powerful advantage, especially in competitive markets where first impressions matter.
Practical Guidance for Choosing and Using This Template
Before you start customizing, think about the story you want the timeline to tell. The three-step structure works best for processes that can be broken into three clear phases or milestones. If your content naturally fits that flow, this template is a strong choice. If you need more steps, you might want to look at a different layout—but for many common use cases, three steps is exactly right.
When it comes to font pairings, the template allows plenty of flexibility. Since the design is minimal and modern, a clean sans serif font works well for headings and labels. You could also use a serif font for a more editorial or premium feel. The key is to keep the typography simple so it doesn’t compete with the wave element and icons. A bold sans serif for the step titles and a lighter weight for the descriptions is a reliable combination.
Color customization is another area where you can make the template your own. The red, yellow, and blue gradient is striking, but it may not suit every brand. If you need to match a specific color palette, the vector format makes it easy to adjust the gradient stops or replace them with solid colors. Just be mindful of contrast—make sure the text remains legible against the wave background, especially if you’re using a dark gradient.
Commercial licensing is straightforward with this type of asset. Because it’s a design template rather than a font or software, you’re generally free to use it in client projects, commercial campaigns, and published materials. Always check the included license file for specifics, but in most cases, you can use the template for both personal and business purposes without additional fees.
If you’re using this template in a team setting, the editable layers and organized file structure make collaboration easier. Designers can pass the Ai or EPS file to a colleague without worrying about missing elements or broken links. The well-organized layers also mean you can hide or modify individual components without affecting the rest of the layout. That’s a small detail, but it saves time in the long run.
Realistic Examples and Design Observations
Imagine you’re a marketing manager preparing a quarterly campaign recap for your leadership team. Instead of listing three key initiatives in a bullet point slide, you use the Wave Data Infographic Timeline to show the campaign phases: Awareness, Engagement, Conversion. The wave element visually communicates momentum, and the gradient colors subtly reinforce the idea of progression. Your team doesn’t just read the information—they see the story.
Or consider a freelance designer pitching a brand identity project to a new client. The three steps could be Discovery, Design, and Delivery. The timeline format reassures the client that there’s a clear process in place, and the modern design reflects the quality of work they can expect. In this context, the template functions as both a communication tool and a credibility builder.
One design observation worth noting: the square layout makes this template particularly effective for social media graphics, especially on platforms like Instagram and LinkedIn where square images perform well. You could create a carousel post where each step is highlighted on a separate slide, or use the full timeline as a single, scannable graphic. The high resolution and vector quality ensure it looks sharp on both mobile screens and desktop displays.
Another practical point: because the template includes separated icon shapes within circles, you can easily replace the default icons with custom ones that match your subject matter. This is especially useful for branded content where consistency matters. If you’re working on a series of infographics, using the same layout with different icons creates a cohesive visual language across your materials.
For educators and trainers, this template can be adapted for workshop handouts or online course materials. The three-step format is ideal for explaining a skill or concept in a structured way—like the three stages of a design sprint or the three pillars of a marketing strategy. Learners appreciate the clarity, and the visual design helps with retention.
Ultimately, the Wave Data Infographic Timeline is a practical, well-crafted design asset that saves you time while elevating your visual communication. It gives you a strong foundation to build on, without restricting your creativity. Whether you’re a seasoned designer or a business owner putting together your first presentation, this template helps you tell your story with clarity and impact.