From Data to Action: How Ecology Infographic Template V2 Simplifies Environmental Storytelling
Numbers, charts, and research reports—ecology is rich in data, yet that data rarely reaches the people who need it most. Complex environmental statistics can feel abstract, buried in spreadsheets or academic papers. That is where visual communication bridges the gap. Ecology Infographic Template V2 offers a practical solution for transforming dense ecological information into clear, shareable visuals. Whether you're preparing a sustainability report, designing classroom materials, or launching an environmental campaign, this template helps you present key concepts without losing depth or accuracy.
This article explores the template's purpose, features, real-world applications, and practical strengths so you can decide if it fits your next project.
Understanding the Purpose of Ecology Infographic Template V2
At its core, Ecology Infographic Template V2 is designed to make environmental data accessible. It blends thoughtful layout structures with visual hierarchy, helping viewers grasp cause-and-effect relationships, trends, and comparisons at a glance. Unlike generic infographic templates, this one centers on ecological themes—biodiversity, carbon cycles, conservation metrics, and sustainable practices—ensuring that the design supports the message rather than distracting from it.
The template serves multiple roles. For educators, it turns lesson plans into memorable visual aids. For sustainability officers, it translates annual metrics into stakeholder-friendly summaries. For marketers, it creates campaign assets that communicate eco-conscious values without greenwashing. The unifying goal is clarity: when people see ecological data in a well-structured infographic, they understand it faster and remember it longer.
This version builds on its predecessor by refining layout flexibility, improving iconography relevance, and ensuring compatibility across modern design tools. It is not merely a set of shapes and text boxes—it is a strategic framework for storytelling with environmental data.
Core Features That Make a Difference
Ecology Infographic Template V2 comes with several practical attributes that set it apart from generic offerings. Below are the standout features worth understanding:
Three Unique Design Variations
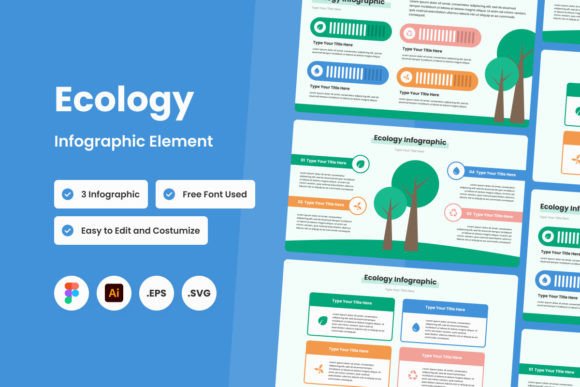
Instead of a one-size-fits-all layout, you receive three distinct design variations. Each variation approaches hierarchy differently—one may emphasize large central statistics, another may use a timeline structure, and a third might rely on segmented comparison blocks. This variety allows you to choose a layout that matches your content type, whether you're presenting yearly emissions reductions or explaining food web interactions.
Ease of Customization
Templates lose value when they are difficult to adapt. This one is built with straightforward customization in mind. Colors, text, icons, and data points can be adjusted without wrestling with hidden layers or broken alignments. Even if you are not a professional designer, you can replace placeholder content with your own numbers and narratives in minutes. The structure remains intact, preserving visual balance as you edit.
Neat and Organized Layers
All elements—backgrounds, icons, text boxes, and data widgets—are arranged in neatly named layers. This organization is especially useful when working in vector editing software. You can hide, lock, or modify individual components without affecting adjacent elements. For collaborative projects, this layer discipline reduces errors and speeds up revisions.
Open Source Fonts
Font licensing can be a hidden headache in template usage. Ecology Infographic Template V2 uses open source fonts that are freely available and accessible to everyone. You will not need to purchase additional licenses or worry about redistribution restrictions. This is particularly valuable for educators and nonprofit organizations operating with limited budgets.
Full File Format Support
The template package includes .Fig, .Ai, .Eps, and .Svg formats. This range ensures compatibility with major design software including Figma, Adobe Illustrator, and various vector editors. The SVG format also allows direct integration into web projects and interactive presentations. Whether you work on a Windows, Mac, or Linux environment, you will find a usable format.
Real-World Applications Across Sectors
Understanding features is one thing; seeing them applied is another. Here are concrete scenarios where Ecology Infographic Template V2 adds measurable value:
Sustainability Reporting for Businesses
Companies preparing annual ESG (Environmental, Social, Governance) reports often struggle to present emissions data, water usage, and waste reduction metrics in a compelling way. Using this template, a sustainability manager can convert a table of carbon footprint numbers into a single-page infographic that executives and investors can absorb quickly. The three design variations allow the manager to test which layout communicates their specific data most clearly.
Classroom Ecology Lessons
A high school biology teacher covering ecosystems and energy flow can use the template to create a visual summary of trophic levels, biomass pyramids, or nutrient cycles. Instead of handing out a textbook diagram, the teacher customizes the infographic with local species data and regional context. Students engage more deeply when the visual feels current and specific rather than generic.
Environmental Campaign Materials
Nonprofit organizations running awareness campaigns around ocean plastic, deforestation, or urban green spaces can produce poster-style infographics for social media, newsletters, and community boards. The clean layout and open source fonts ensure the final product looks professional without requiring a design agency.
Conference and Workshop Handouts
Speakers at environmental conferences often need leave-behind materials that summarize their talk without overwhelming attendees. An infographic created from this template can serve as a one-page reference that reinforces key statistics and calls to action. Because the file formats are flexible, the same design can be printed, projected, or shared digitally.
Who Benefits Most from This Template
While the template is broadly useful, certain audiences will find it especially aligned with their workflow:
- Environmental educators and curriculum developers who need to simplify complex topics without losing scientific accuracy.
- Corporate sustainability teams tasked with communicating progress to non-technical stakeholders.
- Nonprofit communicators managing awareness campaigns with limited design resources.
- Freelance designers and marketers serving eco-conscious clients who want data-driven visuals.
- Students and researchers preparing poster presentations for conferences or symposiums.
If your work regularly involves translating ecological data into shareable formats, this template reduces repetitive layout work, freeing you to focus on content accuracy and narrative flow.
Practical Considerations When Choosing an Infographic Template
No template is perfect for every situation. Understanding the strengths and limitations of Ecology Infographic Template V2 helps you decide when it fits and when you might need a different approach.
Strengths
- Time efficiency: Starting with a pre-built layout saves hours compared to building from scratch.
- Visual consistency: The three design variations maintain a cohesive aesthetic, so you can mix and match elements across projects.
- Professional output: Even first-time users can produce results that look polished and deliberate.
- Cost-effective: Open source fonts and multiple file formats reduce hidden expenses.
Limitations to Consider
- Image sourcing: Preview images are not included, meaning you must provide your own photographs or illustrations. If you lack a library of environmental imagery, you will need to budget time or money for sourcing.
- Software requirement: While formats are diverse, you still need access to compatible software (e.g., Figma, Illustrator, or another vector editor). Web-based tools may require format conversion.
- Content depth: Infographics excel at summaries, not deep dives. If your data requires extensive footnotes, methodology explanations, or caveats, you may need supplementary pages or a different medium.
Evaluating Suitability for Your Project
Before downloading, ask yourself these questions:
- What is the primary message I need to communicate? (Trend, comparison, process, or call to action?)
- Who is my audience, and what level of detail do they need?
- Do I have the necessary images and data ready, or do I need to source them separately?
- Which file format matches my design workflow?
Answering these questions will guide you to the right design variation and help you avoid customization delays later.
Making the Most of Your Ecology Infographic
Once you have selected and customized Ecology Infographic Template V2, consider these best practices to maximize impact:
- Lead with a headline that states the takeaway: Instead of "Carbon Emissions 2024," try "How Our Emissions Dropped 18% in One Year." The template's layout supports prominent headline placement, so use it strategically.
- Limit statistics to three to five key figures: Visual memory works best with focused data points. Choose the numbers that directly support your narrative.
- Use consistent color coding: If you represent different ecosystem types or emission sources, assign distinct colors and keep them consistent throughout the infographic.
- Include a clear source line: Credibility matters in environmental communication. List your data sources in small text at the bottom of the graphic.
- Test readability at different sizes: What looks clear on a screen may become crowded on a printed poster. Scale your design early to avoid surprises.
A Balanced Look at the Template's Value
Ecology Infographic Template V2 occupies a useful middle ground. It is not a fully automated data visualization tool—it will not connect to live databases or generate charts from raw spreadsheets. But it is also not a rigid, one-use layout. It gives you structured flexibility, letting you inject your content into a professionally designed framework while maintaining control over every visual detail.
For professionals who already understand their data and simply need a clean, ecology-themed container to present it, this template removes the friction of layout design. For beginners, it offers a guided starting point that teaches effective visual hierarchy through example.
The template's focus on ecological themes also reduces the risk of mismatched aesthetics. A generic infographic might use icons and color palettes that feel disconnected from environmental topics. Here, the design language aligns with nature—earthy tones, leaf motifs, flow diagrams, and organic shapes—so the visual reinforces the subject matter.
Final Thoughts
Environmental communication faces a persistent challenge: important data often fails to engage because it looks like work. Infographics solve that by making information feel intuitive, scannable, and even inspiring. Ecology Infographic Template V2 equips you with a practical tool to meet that challenge head-on. Whether you are showing a community how much waste they diverted from landfills, teaching students how carbon moves through an ecosystem, or reporting to stakeholders on sustainability progress, this template helps your data speak clearly.
Download it, customize it, and let your ecological insights reach the audience they deserve.