Up and Right Arrow Infographic: A Practical Tool for Risk Communication and Strategic Clarity
If you have ever tried to explain a risk management strategy to a room full of stakeholders, you know how quickly things can get muddled. Numbers get thrown around, timelines blur, and before you know it, everyone is nodding politely without truly understanding the core message. This is where the Up and Right Arrow Infographic steps in as more than just a pretty slide. It is a visual framework designed to turn abstract risk concepts into something people can actually follow, remember, and act on.
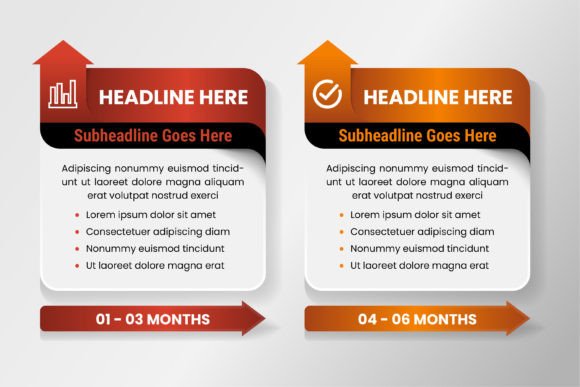
At its heart, this infographic template uses a simple but effective visual language: an upward arrow paired with a rightward arrow, creating a natural flow that suggests progress, escalation, or forward movement. Combined with four distinct option points and a rectangle arrow on the bottom side, it becomes a structured way to present risk scenarios, mitigation steps, or comparative analyses. The template is built as a 100% vector graphic, available in high resolution (300 dpi), with editable text, shapes, and colors. You get files in AI, EPS, JPG, and SVG formats, which means you can adapt it for print, web, or live presentations without losing quality.
But the real value is not in the file formats. It is in how you apply this visual tool to real situations where clarity matters most. Let me walk you through some of the most practical ways people are using this infographic right now, across different industries and purposes.
Risk Management Presentations That Actually Get Understood
Risk management is inherently about uncertainty, and uncertainty does not communicate well in bullet points. When you are presenting a risk matrix or a threat assessment, your audience needs to see the relationship between likelihood, impact, and response. The Up and Right Arrow Infographic is particularly effective here because the arrow direction naturally suggests escalation or movement from lower to higher risk.
Imagine you are a project manager presenting a quarterly risk review to your team. You have four key risks to discuss. Instead of listing them in a flat table, you place each risk at one of the four option points along the arrow path. The first point might represent low-likelihood, low-impact risks. The second point moves up and right, showing risks that are becoming more probable. The third point lands at a moderate threshold, and the fourth point sits at the top-right corner, representing high-priority, high-impact risks that need immediate attention. The upward motion visually reinforces the idea of increasing severity, while the rightward motion suggests progression over time or across categories.
What makes this work so well is that your audience does not need to decode a complex chart. They see the arrow, they see the four points, and they intuitively understand that things are moving in a certain direction. You can color-code each point, add brief labels, and keep the text minimal. The editable nature of the template means you can adjust the colors to match your company branding or the specific risk categories you are using.
Strategy Roadmaps and Decision Trees
Beyond pure risk management, this infographic template is surprisingly useful for strategic planning. The up-and-right arrow combination naturally suggests growth, improvement, or escalation, which makes it a natural fit for decision trees, action plans, or progression models.
For example, a marketing team planning a quarterly campaign might use the four points to represent stages of customer engagement: awareness, consideration, conversion, and retention. The upward arrow indicates increasing engagement, while the rightward arrow shows the timeline moving forward. Each point becomes a milestone with specific actions, metrics, or resources attached. The rectangle arrow on the bottom side can serve as a call-to-action bar, summarizing the key takeaway or the next step for the team.
Startup founders often use this template when pitching to investors. They map their growth journey across four phases: product development, market entry, scaling, and profitability. The upward trajectory visually reinforces the growth story, and the clean, geometric layout keeps the slide from looking cluttered. Since the template is fully editable, you can adjust the arrow thickness, the size of the option boxes, or the gradient colors to match your pitch deck aesthetic.
Training Materials and Educational Content
If you create training materials or educational content, you know that adults learn best when information is structured visually. The Up and Right Arrow Infographic works well for explaining processes that have a clear sequence or progression. Compliance training, safety protocols, onboarding checklists, or step-by-step guides all benefit from a visual that shows movement from one stage to the next.
Consider a workplace safety training session. You need to explain the four stages of hazard reporting: identify the hazard, assess the risk, implement controls, and review effectiveness. Each stage can sit at one of the four arrow points. The upward and rightward motion implies that you are moving toward better safety outcomes, which is exactly the message you want to reinforce. The rectangle arrow at the bottom can hold a reminder like "Report any hazard immediately" or a link to the reporting system.
The advantage here is that the template is not tied to any specific industry jargon. Whether you are training warehouse staff, office workers, or field technicians, the visual structure remains intuitive. You can swap out icons, adjust text, and reuse the same template across multiple modules without starting from scratch each time.
Comparative Analysis and Option Evaluation
Another practical use case is comparing four options, strategies, or scenarios. The four points on the arrow naturally invite comparison. You might use the vertical axis to represent cost or effort, and the horizontal axis to represent impact or benefit. Each of the four options lands at a different position on the arrow, giving you an instant visual comparison of which option offers the best balance.
This is particularly useful in consulting or advisory roles. If you are a financial advisor presenting investment options to a client, you can place four different portfolios along the arrow. The upward direction represents potential return, and the rightward direction represents time horizon. The client can see at a glance which options align with their risk tolerance and goals. The rectangle arrow at the bottom can display a summary comparison or a recommendation note.
The strength of this approach is that it avoids overwhelming the audience with numbers. Instead of a spreadsheet, they get a visual map. You can still include key metrics in the option boxes, but the arrow does the heavy lifting of communicating the overall story.
Considerations Before You Use the Template
While the Up and Right Arrow Infographic is versatile, it is not a one-size-fits-all solution. Understanding its strengths and limitations will help you use it more effectively.
One limitation is that the arrow direction implies a positive progression. Up and right usually suggest growth, improvement, or increase. If your content is about decline, reduction, or negative trends, this visual direction might send the wrong message. For example, if you are presenting a risk assessment where the goal is to reduce risk, an upward arrow could confuse your audience. In those cases, you might want a downward or leftward arrow instead.
Another consideration is the number of options. The template is designed for exactly four points. If you need to present three or five options, you would need to modify the layout or choose a different template. That said, four is a surprisingly common number in business communication – four quarters of the year, four strategic pillars, four stages of a project, four risk categories. So it often fits naturally.
The editable nature of the template is a double-edged sword. While it gives you flexibility, it also means you need to invest some time in customization. If you are not comfortable using vector editing software like Adobe Illustrator, you might find it easier to work with the JPG version for quick edits or the SVG version for web use. The AI and EPS files offer full control but require some familiarity with the tools.
Also, keep in mind that the template is provided in English. If you need it in another language, you will need to edit the text fields yourself. The text is editable, so that is straightforward, but it is worth noting if you are working with a multilingual team.
Who Benefits Most from This Template
Based on what I have seen, this template resonates most with professionals who regularly present data or strategy to mixed audiences. Project managers, risk officers, marketing leads, startup founders, consultants, and trainers all find value in its clean structure. It also works well for content creators who need visual assets for blog posts, social media graphics, or downloadable resources.
The 300 dpi resolution and vector format mean you can use it in print materials like brochures, handouts, or posters without worrying about pixelation. The JPG version is handy for quick sharing, while the SVG version keeps file sizes small for web use without sacrificing quality.
One observation from users I have spoken with is that the template saves them time not because it is pre-designed, but because it gives them a starting point that already makes visual sense. Instead of staring at a blank slide, they have a structure that guides both their content and their audience's understanding.
The rectangle arrow on the bottom side is an underrated feature. It works well as a footer for additional context, a source note, a key takeaway, or a call to action. Many users treat it as the "so what" section of the slide, where they summarize the one thing the audience should remember.
Practical Tips for Getting the Most Out of the Template
When you download the files, start by opening the AI or EPS version in your preferred vector editor. Adjust the base colors to match your brand palette. The gradient fills in the template are attractive, but you can switch to solid colors if you prefer a flatter look for modern presentations.
Think about the icons you will place at each option point. The template includes space for an icon at each of the four points. Choose simple, recognizable icons that reinforce your message. Avoid overly detailed icons that clutter the visual. The arrow itself should remain the focal point.
Use the rectangle arrow at the bottom strategically. Do not treat it as an afterthought. Decide what single piece of information is most important for your audience to take away, and place it there. It could be a percentage, a deadline, a recommendation, or a question that prompts discussion.
Finally, test the template with a small audience before using it in a high-stakes presentation. Show them the slide for five seconds, then ask what they remember. If they can recall the main message and the four points, the template is doing its job. If they are confused about the arrow direction or the relationship between the points, adjust your labels or color coding.
The Up and Right Arrow Infographic is not a magic solution, but it is a practical, well-designed tool that solves a common problem: how to communicate structured information in a way that feels natural and easy to follow. Whether you are managing risks, mapping strategies, training teams, or comparing options, it gives you a visual shorthand that your audience will appreciate. And with the editable files included, you can make it your own without starting from a blank canvas.