Map Your Success with the Goal Infographic Template
You have ambitions. Big ones. Maybe it is launching a side business, finishing a certification, running a marathon, or hitting a quarterly revenue target. The gap between where you are and where you want to be can feel wide. That gap is where most people stall. Not because they lack drive, but because they lack a clear visual of the path. A Goal Infographic Template changes that. It turns abstract ambition into a concrete map. You stop guessing and start tracking. This article walks through how to use one well, and more importantly, what to avoid so your goals actually materialize.
What a Goal Infographic Template Really Offers
At its core, a goal infographic template is a pre-built visual framework. It gives you space to define objectives, chart milestones, mark progress, and celebrate wins. Think of it as a dashboard for your aspirations. Instead of a messy notebook or a forgotten spreadsheet, you get a clear, shareable, and motivating layout. People are drawn to them because visuals stick. You see the finish line. You see the steps. You see how far you have come. That clarity alone can sustain momentum when motivation dips.
But a template is only as good as how you use it. Many people grab one, fill it in hastily, and wonder why nothing changes. The template is not magic. It is a tool. Used well, it keeps you accountable. Used poorly, it becomes just another file on your computer.
Common Mistakes That Undermine Your Goal Infographic
Let us look at where people tend to go wrong. These mistakes are fixable. Once you know them, you can sidestep them entirely.
Mistake 1: Treating the Template as a One-and-Done Document
The biggest error is filling out the template once and never revisiting it. You set your goal, plot some milestones, and close the file. A few weeks later, you have drifted off course, and the infographic sits untouched. That defeats the purpose. An infographic is meant to be a living reference. It should evolve as you progress, as priorities shift, and as you learn what works.
How to avoid it: Schedule a weekly or bi-weekly check-in. Open the file, review your milestones, and update your progress. Even five minutes keeps the goal top of mind. If you are using a digital tool like Figma or Adobe XD, keep the file accessible on your desktop or in a pinned tab. Make it the first thing you see when you start your week.
Mistake 2: Overloading the Visual with Too Many Goals
It is tempting to pack everything into one infographic. Career goals, fitness goals, financial goals, learning goals, relationship goals. The result is visual noise. Nothing stands out. You end up with a chaotic poster that overwhelms rather than inspires. When every item competes for attention, you lose the clarity that made you want the template in the first place.
Better approach: Create separate infographics for different life areas, or group related goals under one umbrella theme. For example, if you are a freelancer, one infographic could cover project milestones for a big client deliverable. Another could track your monthly income targets and skill development. Each infographic should have a single focus. That focus makes the visual easy to scan and act on.
Mistake 3: Ignoring the Template’s Built-In Structure
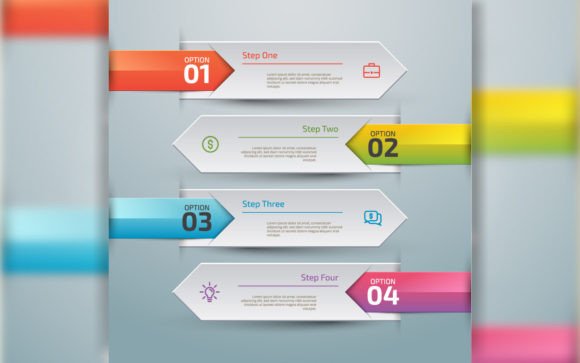
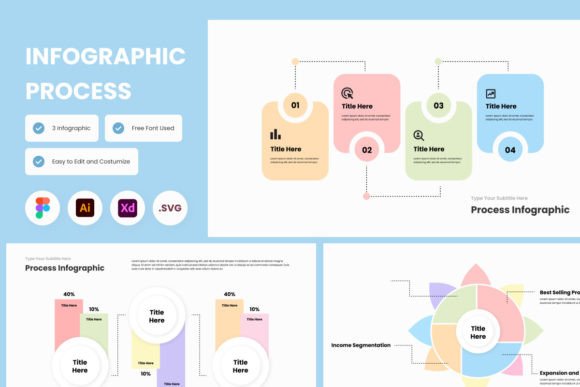
The templates in this set come with thoughtful layouts. They include sections for objectives, progress indicators, timelines, and achievement markers. Some people ignore those sections and just paste text wherever it fits. That undermines the logic of the design. The hierarchy of information matters. If you place a secondary milestone where the primary objective should go, you confuse your own brain.
How to use the structure wisely: Spend ten minutes studying the template before you type anything. Notice how the designer arranged the elements. The largest space likely indicates the main goal. The timeline or progress bar shows incremental steps. The achievement area is for celebrating wins. Follow that logic. It works because it mirrors how our brains process progress. If you need to adjust, do it intentionally. Move elements only when you have a clear reason.
Mistake 4: Choosing the Wrong Tool for Customization
This template set comes in .fig, .xd, .ai, and .svg formats. That is generous. But not everyone is comfortable with all those tools. A beginner might open the .ai file in Adobe Illustrator and feel lost. The layers, the paths, the text tools. It can be intimidating. Some people give up because they try to force a tool they do not know.
Practical advice: Start with the tool you already understand. If you have never used Figma, Adobe XD, or Illustrator, begin with the .svg file. SVG files open in any browser and can be edited in free tools like Inkscape or even PowerPoint with the right plugins. If you are ready to learn, Figma has a generous free tier and a gentle learning curve. Pick one tool, learn its basics, and then customize the template. Do not try to learn three tools at once. That leads to frustration and abandoned projects.
Mistake 5: Forgetting to Define Measurable Milestones
A goal like “grow my business” sounds great but is impossible to track visually. What does progress look like? If you cannot answer that, the infographic becomes a wish list instead of a plan. The template asks for objectives and progress, but it is up to you to supply the numbers or criteria that make those things real.
How to fix it: Attach a specific metric to each stage. Instead of “increase sales,” write “reach $5,000 monthly recurring revenue by June.” Instead of “get fit,” write “complete three strength workouts per week for eight weeks.” When you can measure it, you can plot it on the timeline. That turns the infographic from a decoration into a dashboard. You will know exactly where you stand at any point.
Mistake 6: Skipping the Celebration Step
Many templates include a section for achievements or wins. People often leave that part empty. They think, “I will fill it in when I get there.” But they never do. Or they reach the goal and immediately move to the next one without pausing. That is a missed opportunity. Celebrating a win reinforces the behavior that got you there. It also builds positive momentum for the next goal.
Better habit: As soon as you hit a milestone, update the achievement section. Write a sentence about what you did and how it felt. If the template has a visual trophy or star icon, use it. That small act of marking a win keeps you engaged and makes the journey rewarding, not just the destination.
What to Check Before You Download or Buy
Before you commit to any goal infographic template, run through a short checklist. It saves time and money.
- Check the file formats. This template includes .fig, .xd, .ai, and .svg. That covers the major design platforms. If you use something else, like Sketch or Affinity, confirm that you can open at least one of these formats.
- Check font licensing. The template uses open source fonts. That is excellent. It means you do not need to buy a font license to use it commercially or share it. Always verify this before buying any template to avoid legal surprises.
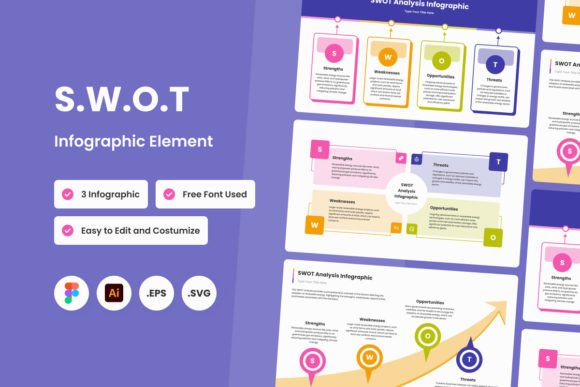
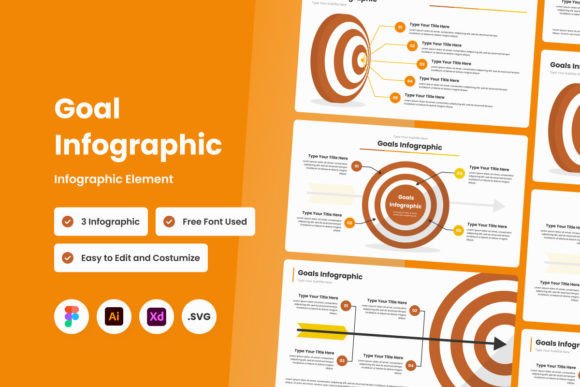
- Check the template structure. Look at the preview images. Does the layout match your thinking style? Some people prefer a linear timeline. Others like a circular roadmap. Pick the one that feels natural to you.
- Check the editing difficulty. If you are new to design tools, look for templates labeled as easy to adjust. This one is designed with clarity in mind, but still, watch a quick tutorial on the tool you plan to use before you start.
Practical Examples of Using the Template Well
Let me give you two realistic scenarios so you can see how this works in practice.
Scenario A: A freelance graphic designer launching a new service.
The designer opens the template in Figma. The main objective box reads: “Launch packaging design service by March 1.” Under milestones, they list: “Create portfolio examples (by Feb 1), Build landing page (by Feb 15), Write service guide (by Feb 20), Send email to 50 past clients (by Feb 25).” Each milestone gets a progress bar. As weeks pass, they update the bars. By March 1, the service is live, and the achievement section shows a note: “Secured two retainer clients in the first week.” That infographic becomes a case study they can share with prospects.
Scenario B: A marketing manager tracking a product launch.
They use the template in Adobe XD. The main goal is “Launch Q3 product with $100k pre-orders.” Milestones include content milestones, ad spend targets, and partnership announcements. The visual layout helps them present progress to stakeholders in a weekly stand-up. Instead of a boring report, they show the infographic. Everyone sees where things stand at a glance. That builds trust and keeps the team aligned.
How to Keep Your Infographic Effective Over Time
The value of a goal infographic template grows the longer you use it. It is not a sprint tool. It is a marathon companion. Here are a few maintenance habits that keep it relevant.
- Review and revise milestones quarterly. Goals shift. Market conditions change. Personal priorities evolve. Your template should reflect that. Do not be afraid to edit a milestone that no longer serves you. That is not failure. That is adaptability.
- Share it with an accountability partner. If your template is digital, share a read-only link with a friend, mentor, or colleague. Knowing someone else can see your progress adds gentle pressure to follow through.
- Use the same template for different time horizons. One template can hold a 90-day goal. Another can hold a yearly vision. The structure scales. You just adjust the time markers.
Final Thoughts on Choosing a Goal Infographic Template
A good goal infographic template is not about fancy graphics. It is about structure, clarity, and motivation. The templates in this set give you a high-quality screen layout, open source fonts, and flexible file formats compatible with Figma, Adobe XD, Adobe Illustrator, and more. But the real power lies in how you use it. Avoid the mistakes of overcrowding, ignoring the structure, or treating it as a one-time task. Instead, make it a weekly touch point. Define measurable steps. Celebrate each win. Over time, that small habit transforms how you pursue your ambitions. You stop hoping and start tracking. You stop guessing and start seeing. That is the difference between a goal that stays on a wish list and a goal that becomes reality. Set your sights on success. Let the template show you the way.