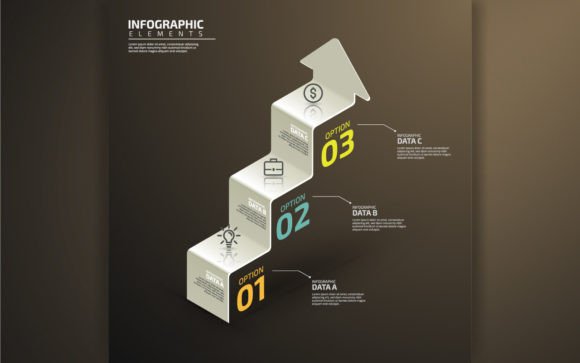
Master Your Presentations with the Business 4 Steps Chart and Numbers Arrow Template
You have spent hours refining your data, writing the perfect bullet points, and rehearsing your pitch. Then you drop in a generic graphic to illustrate your process, and it feels flat. The colors are slightly off, the fonts are too small, and the layout just doesn’t communicate the clarity you need. This is where a well-structured design template like the Business 4 Steps Chart and Numbers Arrow becomes invaluable. It provides a clean, professional foundation for communicating growth, timelines, or sequential workflows.
However, simply purchasing or downloading a vector template isn’t a magic solution. The difference between a graphic that looks polished and one that looks amateurish often comes down to a few key decisions. The template is created with Adobe Illustration and includes an AI File, EPS File, and high-resolution JPG File. To truly make it work for your brand, you need to understand the tools, avoid common pitfalls, and apply a thoughtful customization process. This guide walks through the practical steps to doing exactly that.
Why Choosing the Wrong File Format Sabotages Your Work
One of the most frequent mistakes people make is misunderstanding the role of each file format inside the download pack. You have three distinct assets: a vector AI file, a vector EPS file, and a high-resolution JPEG. Each serves a purpose.
The JPEG is straightforward. It is a raster image, meaning it is made of pixels. You can drop it into a PowerPoint slide or a Word document instantly. It is great for speed. However, if you try to scale it up for a banner, it becomes pixelated. If you want to change the text inside the numbered arrows, you cannot edit a JPEG. You are stuck with what you see.
The AI file, created with Adobe Illustration, is where the real power lies. This file contains layers, vectors, and editable text. You can change the color palette, adjust the arrow shapes, and type your own copy directly into the numbered steps. A common workflow mistake is opening the JPEG in Photoshop and trying to manually erase text to replace it. This is messy and time-consuming. Instead, open the AI file. The EPS file offers similar vector editing capabilities and is often compatible with a wider range of vector software, including older versions of Illustrator or other editing suites.
Before you start, check your software. If you do not have a vector editing application, you cannot leverage the AI or EPS files effectively. You will be limited to the static JPEG. This is fine for final delivery, but it eliminates your ability to customize. Make sure you download the correct format for your intended use case.
Three Critical Mistakes That Ruin a Perfectly Good 4-Step Chart
Even with the right file open, there are specific traps that can turn a clean graphic into a confusing mess. The Business 4 Steps Chart and Numbers Arrow is designed for clarity. Here is how to maintain that clarity.
Overcomplicating the Simple Structure
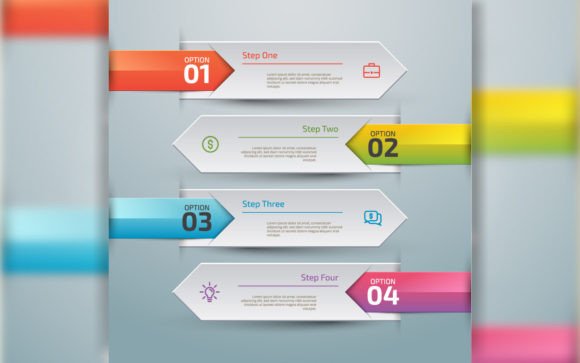
The template is built around a sequence of four steps. It represents a linear flow or a progressive timeline. A very common mistake is trying to force too much information into each arrow section. For example, if you are outlining a marketing strategy, Step 1 might be "Research." A mistake would be cramming "Research, Competitor Analysis, and Audience Persona Development" into that single space.
This clutter defeats the purpose of using a visual chart. If your audience has to read a paragraph inside an arrow, they will skip it. The graphic should provide a high-level overview that supports what you are saying aloud. If you have more than a few words per step, you either need to simplify your copy or find a template with more space. Respect the structure of the four steps. It forces you to distill your message to its most essential points.
Ignoring Brand Consistency in Colors and Fonts
A template comes with default colors. They look good. That is why you chose the template. However, using those colors without adjusting them to your brand identity is a missed opportunity. If your company uses a specific blue and a specific green, but your chart uses the default teal and orange, it will look disconnected from the rest of your presentation.
When you open the AI file, look for the color swatches panel. Well-organized templates have global swatches. You can change a single swatch, and it updates every element using that color across the entire graphic. This makes rebranding the chart incredibly efficient. Similarly, check the fonts. If your presentation uses Montserrat, but the chart uses Open Sans, change it. These small details of consistency build trust with your audience. They signal that you pay attention to the whole picture.
Misunderstanding the Arrow's Directional Flow
An arrow chart implies movement or progression from left to right or bottom to top. A frequent oversight is using a linear 4-step arrow for a cyclical process. If Step 4 leads directly back to Step 1 in reality, a straight arrow is visually confusing. You would be better served by a circular or cycle diagram.
Using the Business 4 Steps Chart and Numbers Arrow correctly means respecting that linear flow. It works perfectly for quarterly goals (Q1, Q2, Q3, Q4), a sales funnel (Awareness, Interest, Decision, Action), or project phases (Initiation, Planning, Execution, Closure). If your process repeats indefinitely, look for a different diagram type. Forcing a circle into an arrow creates a fundamental logical error in your visual communication.
What to Check Before You Buy or Download
Before you invest in any design template, a few minutes of verification can save you hours of frustration. The description says it is easy to use and includes specific file formats. Here is what you should confirm.
- Software Compatibility: Do you have access to Adobe Illustrator or a vector editor like Inkscape or Affinity Designer? If not, consider whether the high-resolution JPEG alone is worth the cost for your project. The AI and EPS files are powerful, but only if you can open them.
- Layer Organization: A good template, like this one, is built with clean layers. Look for reviews or previews that show the layer panel. Messy files with hundreds of unlabeled layers are frustrating to edit. Organized files allow you to select "Text," "Arrows," and "Numbers" separately.
- Font Licensing: The template uses specific fonts. If you do not have those fonts installed on your computer, the file will either substitute a similar font or prompt you to download it. Check if the fonts are free for commercial use or if you need to purchase a license. Alternatively, you can convert the text to outlines in Illustrator to avoid font issues, but this makes future text edits impossible.
- Usage License: Are you using this for a client deliverable? Ensure the template license allows for commercial use. Most standard templates do, but it is always smart to check the terms so you avoid legal or ethical issues down the line.
Practical Workflow for a Polished Result
Once you have verified the files and understand the structure, following a simple workflow helps you deliver a professional result quickly. Start by unzipping the download folder. You will see the AI, EPS, and JPG files.
Open the AI file in your vector software. The first thing you should do is update the colors. Use your brand's official hex codes or CMYK values. This single step instantly transforms a generic template into a branded asset.
Next, replace the placeholder text. Keep your copy concise. Instead of "Step One: Initial Discovery Meeting," try "1: Discovery." The numbers in the "Numbers Arrow" are there to guide the eye. Let them do the heavy lifting. Your text should support the number, not compete with it.
Finally, consider your output. If you are inserting this into a Keynote or PowerPoint presentation, export the final graphic as a high-resolution PNG with a transparent background. This allows it to sit seamlessly on your slide background. The provided JPEG is a solid fallback, but exporting directly from the AI file gives you the highest quality control over the final result.
Getting Real Value from Your Vector Template
Investing in a professionally created design template is a smart move for entrepreneurs, marketers, educators, and freelancers. It saves you the time of building complex vector shapes from scratch. However, the value is unlocked through customization. A static, unedited template feels lazy. A carefully adapted graphic feels custom.
Use the Business 4 Steps Chart and Numbers Arrow to clarify your quarterly goals in a board meeting. Use it to explain your onboarding process to new clients. Use it to visualize the steps in your blog post or lead magnet. The arrow provides forward momentum, and the numbers provide a clear, logical sequence. When you pair this clean structure with your own data and brand colors, the result is communication that looks effortful and intentional.
Do not underestimate the impact of a well-aligned, properly colored, and clearly labeled chart. It signals competence. It makes your information accessible. By avoiding the common mistakes of format misuse and cluttered design, you ensure that your audience focuses on your message instead of being distracted by a messy graphic.