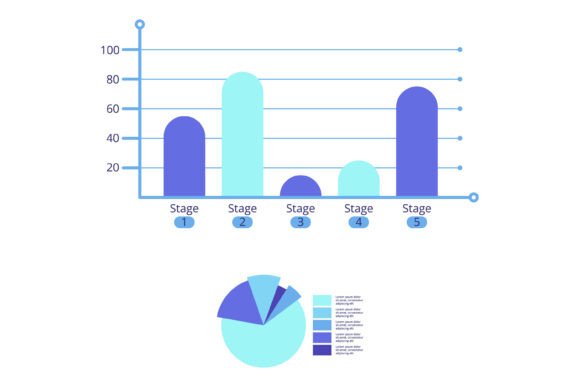
Mastering the Art of Stages and Data Infographics for Clear Communication
Data has become the language of modern decision-making. Yet raw numbers, spreadsheets, and dense reports often leave audiences confused or disengaged. The challenge isn't gathering data—it's making it mean something. This is where a well-constructed Stages and Data Infographics approach transforms complexity into clarity. By blending visual hierarchy with statistical precision, this method turns abstract figures into stories people can actually follow.
Whether you are a business owner reviewing quarterly performance, a teacher explaining trends to students, or a marketer pitching a campaign result, the way you present data determines whether your message lands or falls flat. A carefully designed infographic that pairs a bar graph with an accompanying pie chart does more than decorate a page—it structures understanding.
What Makes Stages and Data Infographics Different
Most data visualizations aim to display information. A Stages and Data Infographics ensemble goes further: it guides the viewer through a logical progression. Instead of dumping all numbers at once, it breaks information into digestible stages. The bar graph shows comparisons or trends over time, while the pie chart reveals proportions within a whole. Together, they answer two fundamental questions: How do things compare? and What is the share of each part?
This dual-format design is not accidental. It mirrors how humans naturally process information—first by scanning for differences (bar graphs) and then by understanding distribution (pie charts). When these two elements are combined within a single infographic, the result is a self-contained narrative that requires minimal explanation.
The Bar Graph as a Stage for Comparison
A bar graph within a Stages and Data Infographics collection serves as the primary driver of contrast. Its strength lies in its simplicity: horizontal or vertical bars allow instant visual comparison between categories. For example, a business tracking monthly revenue across four quarters can use bar heights to show which period outperformed others. The eye naturally gravitates toward the tallest bar, making outliers immediately obvious.
What elevates a bar graph in this context is its staging. Instead of showing all twelve months at once, the infographic might group data into quarterly stages, then use color coding to highlight progressions. This staged approach prevents cognitive overload while still delivering a complete picture.
The Pie Chart as a Stage for Proportion
Where the bar graph excels at comparison, the pie chart excels at distribution. A Stages and Data Infographics uses the pie chart to answer what portion of the whole does each segment represent? In a marketing budget breakdown, for instance, the pie chart shows instantly that social media takes 40% while print advertising takes only 15%. This proportional insight is difficult to grasp from a table of numbers.
The key is that the pie chart does not compete with the bar graph—it complements it. One shows magnitude across categories; the other shows share within a category. Together, they provide a comprehensive view that neither could achieve alone.
Real-World Applications Across Sectors
The versatility of a Stages and Data Infographics design makes it useful in nearly every field. Below are practical scenarios where this dual-chart approach delivers measurable value.
- Business and Sales Reporting: A quarterly review infographic uses a bar graph to compare revenue across regions, while a pie chart shows the percentage contribution of each product line. Stakeholders can quickly identify top performers and underperforming areas.
- Education and Academic Research: A teacher explains population growth by staging decades along a bar graph, then uses a pie chart to show age distribution within the latest census. Students grasp both trend and composition in one view.
- Healthcare and Public Policy: A public health campaign visualizes infection rates over six months with a bar graph, while a pie chart displays the proportion of cases by age group. Policymakers see both the trajectory and the affected demographics.
- Marketing and Content Strategy: A content audit uses a bar graph to compare blog post performance by topic, and a pie chart to show the share of traffic from different channels. The team knows which topics to prioritize and which channels to optimize.
- Technology and Product Analytics: A product manager tracks feature usage over release cycles using a staged bar graph, while a pie chart reveals the proportion of users on each device type. Development decisions become data-driven.
These examples illustrate a common thread: Stages and Data Infographics is not a niche tool. It is a universal framework that adapts to the specific questions your data needs to answer.
Strengths and Practical Considerations
Like any communication tool, this infographic style has strengths that make it powerful, as well as limitations that require thoughtful use. Understanding both ensures you deploy it effectively.
Strengths
- Dual Perspective: The combination of bar and pie charts provides two lenses on the same data, reducing the need for multiple visuals.
- Staged Learning: By organizing data into stages, the viewer can follow a narrative without getting lost in details.
- High Retention: Visual information is processed faster and remembered longer than text alone. A well-designed infographic increases message retention significantly.
- Professional Appeal: A polished infographic signals competence and attention to detail, building trust with your audience.
- Cross-Platform Usability: These graphics work equally well in presentations, reports, websites, and social media posts.
Considerations and Limitations
- Data Complexity: If your data has more than five or six categories, a pie chart becomes cluttered. Stick to a limited number of segments for clarity.
- Overcomparison Risk: Viewers may struggle to compare values across two separate charts. Ensure the relationship between bar and pie is clearly explained.
- Design Quality Matters: A poorly formatted infographic can confuse rather than clarify. Use consistent colors, clear labels, and appropriate scales.
- Static vs. Interactive: Printed infographics are static. If your audience needs to explore the data further, consider an interactive version.
When used appropriately, the Stages and Data Infographics approach minimizes these limitations. The key is matching the format to the data story you want to tell.
How to Evaluate Suitability for Your Project
Not every data set benefits from a bar-and-pie combination. Before committing to this format, ask yourself a few diagnostic questions.
- Does my data contain both comparative and proportional information? If you only need to show a single trend over time, a line graph may suffice. If you only need to show parts of a whole, a standalone pie chart works. The dual format adds value when both perspectives matter.
- Can my data be staged logically? Staging works best when there is a natural progression—months, quarters, phases, or steps. If your categories are unrelated, staging may feel forced.
- Who is my audience? General audiences appreciate simplicity. Technical audiences may want more granularity. Tailor the level of detail accordingly.
- What is the delivery medium? For a printed report, static infographics work well. For a live presentation, consider animating the stages to build the story progressively.
If your answers align with these conditions, a Stages and Data Infographics design is likely the right choice. If not, a simpler visualization may serve you better. There is no shame in choosing a bar graph alone when that is all the data demands.
Practical Tips for Implementing This Approach
Whether you are designing the infographic yourself or working with a designer, the following guidelines will help you produce a result that is both beautiful and functional.
- Start with the story. Before choosing colors or fonts, write down the key takeaway you want your audience to remember. Every design decision should serve that message.
- Use consistent color schemes. If a category appears in both the bar graph and the pie chart, use the same color in both. This creates a visual bridge that helps viewers connect the two charts.
- Label clearly. Avoid relying on legends alone. Place labels directly on or near the bars and pie segments when space allows. Direct labeling reduces cognitive effort.
- Order your stages logically. Chronological order works for time-based data. For categorical data, order bars from highest to lowest to emphasize ranking.
- Include a brief narrative. A short title and a one- or two-sentence summary beneath the infographic reinforce the main point. Do not assume the graphics speak entirely for themselves.
- Test with a sample audience. Show the infographic to someone unfamiliar with the data. Ask them what they see. If their interpretation matches your intention, the design works.
Why This Approach Resonates with Audiences
People are naturally visual. Studies indicate that around 65 percent of the population are visual learners, meaning they understand and remember information better when it is presented graphically. A Stages and Data Infographics taps directly into this preference. It reduces the mental effort required to interpret numbers, allowing the audience to focus on the meaning rather than the math.
Moreover, the staged delivery creates a sense of progression. Viewers are not overwhelmed by a wall of data. Instead, they move step by step through the information, building understanding as they go. This approach respects the audience's cognitive limits while delivering depth.
In a world where attention spans are short and information is abundant, clarity is a competitive advantage. The infographic that takes ten seconds to understand will always outperform the report that takes ten minutes to parse.
Final Thoughts
The Stages and Data Infographics method represents a thoughtful fusion of design and data science. It acknowledges that raw numbers are rarely compelling on their own, but that the right visual structure can turn them into insight. By pairing a bar graph with a pie chart within a staged layout, you give your audience both the big picture and the fine details—without forcing them to choose one over the other.
Whether you are preparing a boardroom presentation, a classroom lecture, or a public-facing report, this infographic style offers a reliable path to clearer communication. It does not require you to be a designer or a data scientist. It simply asks you to think about your data in stages, compare what needs comparing, and show what matters most. The result is a message that sticks.
As you plan your next data project, consider the power of staging. Consider the clarity of comparison. And consider how much more your audience will understand when you give them a visual that works as hard as your data deserves.