Business Process Infographic PowerPoint
We’ve all sat through presentations that felt more like a data dump than a story. Walls of text, disjointed charts, and inconsistent visuals can kill even the most compelling business case. The difference between a memorable pitch and a forgettable one often comes down to structure and clarity. That’s where the Business Process Infographic PowerPoint template steps in. It’s not just a set of slides; it’s a complete visual system designed to transform complex workflows into clear, engaging narratives. For anyone who regularly builds decks—whether for client pitches, internal strategy sessions, or conference talks—this tool shifts your focus from formatting to storytelling.
More Than Just Slides – A Visual Operating System
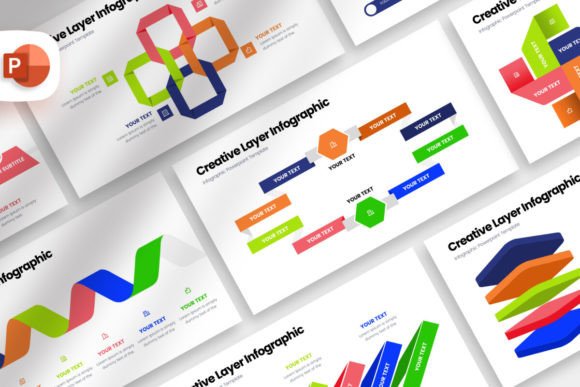
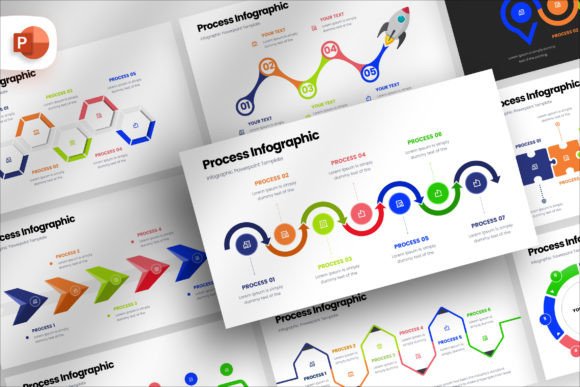
At its core, this template offers 101 unique slides, all built on a standard 16:9 aspect ratio. But the real value lies in its architecture. Each slide functions like a building block for your story. Whether you’re mapping a customer journey, breaking down a supply chain, or outlining a quarterly strategy, the pre-built diagrams, timelines, and flowcharts give you a massive head start. You’re not staring at a blank white page wondering where to begin. Instead, you’re choosing a layout that closely matches your content and then customizing it.
The drag-and-drop picture placeholders are a standout feature. You’re not wrestling with image boxes or manually cropping logos into circles. You simply insert your visual, and the template automatically adjusts the size, transparency, and shape to fit the existing composition. This might sound like a small convenience, but when you’re building a 50-slide deck, it saves hours of tedious clicking. The fonts included in the package—available under a free license—provide a typographic foundation that feels modern and approachable. This is critical for keeping an audience engaged with process-heavy information, because when the mechanics of the deck disappear, the content itself gets to shine.
Crafting a Strong Visual Identity Within the Template
Consistency is the secret weapon of professional design. A brand looks trustworthy when its colors, fonts, and graphical elements feel cohesive across every touchpoint. This template allows you to fully edit every shape, color, and position. You can inject your brand identity directly into the DNA of the presentation. It doesn’t matter if you’re a one-person consultancy or a marketing team of fifty—being able to match the slides to your existing brand guidelines makes you look established and detail-oriented.
Practical recommendation: Before you populate a single slide, set your brand’s primary and secondary colors in the template’s master slide. Replace the sample images with your own product shots or team photos. Swap the placeholder fonts for your brand’s standard typefaces. Doing this upfront ensures that as you build out your 101 slides, everything feels like it belongs together. The result is a deck that looks custom-designed, even though you built it from a template. This kind of polish builds trust with your audience before you even say a word.
Typography – The Voice of Your Infographics
The fonts you choose to use inside this template dramatically influence how the content is perceived. A clean sans serif font like the one included in the package gives a modern, tech-forward feel. This works beautifully for SaaS companies, startups, or internal process documentation where you want to communicate speed and efficiency.
Conversely, if you’re presenting to a more traditional board or a legal audience, you might swap the headings to a serif font to convey stability, history, and authority. Pairing that with a clean sans-serif for body text gives you the best of both worlds: traditional gravitas with modern readability. Infographics rely heavily on visual hierarchy. Your title needs to command attention. Your subheadings need to guide the reader. Your data labels need to be scannable at a glance. The template’s structure supports these distinct layers, but the font pairing you select is ultimately what controls the pace at which the audience absorbs the information.
If you choose a bold display font for your section headers, it will create clear breaks in the narrative, signaling to the audience that a new topic is starting. A more neutral modern typography approach, where the font recedes into the background, works better when you want the data visualizations and charts to be the heroes of the slide. Experiment with the weights and styles included in your system—a light weight for captions, a regular weight for body text, and a bold weight for emphasis creates a professional rhythm without any extra design work.
From Boardroom to Blog – Real-World Applications
The versatility of the Business Process Infographic PowerPoint template makes it a valuable asset across multiple channels and project types. It’s not locked into one specific use case.
- Client Pitches: Walk a potential client through your optimized workflow. Instead of handing them a dense PDF, you guide them through a visually rich timeline. The included mockup device slides are perfect for showcasing your mobile app or web dashboard within the context of the process you’re explaining.
- Internal Training: Onboarding new employees is a classic scenario where process documentation is vital. Use the template to break down complex internal tools or approval chains. The drag-and-drop simplicity means your HR team can update the training deck without needing a graphic designer on staff.
- Content Marketing: Repurpose your presentation into a PDF lead magnet or a series of social media graphics. The clean 16:9 slides translate beautifully into LinkedIn carousels or blog post visuals. This extends the return on investment of your deck far beyond the initial meeting, turning a single presentation into a reusable design asset.
- Annual Reports & Strategy Docs: For publishers and content creators, the template offers a structured way to present complex annual data, roadmaps, or editorial calendars. The pre-built comparison slides and radial diagrams make percentage changes and strategic shifts easy to grasp.
Practical Guidance – Making the Most of the Package
To get the most out of this template, it helps to understand exactly what you’re working with. The package includes the documentation file, the fonts (under a free license for both personal and commercial projects), and the complete set of editable slides. The stock images shown in the previews are not included, but honestly, this is a feature, not a bug. Using your own original photography, product screenshots, or custom graphics makes the presentation feel authentic and aligned with your brand’s reality.
Testing your pairings: Spend thirty minutes in the first slide just experimenting. Apply a bold premium font to the main section headers. See how it interacts with the infographic elements. Does the weight of the font balance the weight of the icons and charts? If the typeface feels too heavy for the data points, switch to a lighter weight or a different sans-serif. The text should support the infographic, not compete with it.
Readability checks: Always preview your slides on a projector or a large monitor before the final presentation. What looks crisp on your laptop screen can feel cluttered when blown up. The template’s generous white space and clean grid system help mitigate this, but your font choice—specifically the size, weight, and color contrast—is ultimately what makes the information accessible to the person sitting in the back of the room.
Commercial licensing: Because the fonts included in the package come with a free license, you can use them in your client work, marketing materials, and even in products you sell, without worrying about legal complications. This is a significant time-saver because you don’t have to go hunting for a separate commercial font license before you can start designing.
Building a Library of Design Assets
Over time, a tool like this becomes more than a one-time download. It becomes a core part of your creative toolkit. Because every element is fully editable, you can deconstruct the slides and pull out individual icons, flowcharts, or data widgets to use in other projects. That single timeline graphic you loved from slide forty-two? You can copy it into a completely different deck and customize the colors to match a new brand.
The 101 slides cover a huge range of layouts—comparisons, sequences, radial diagrams, matrices, and more. As you build your brand identity across different projects, returning to this template ensures a consistent hand and a professional baseline. You stop worrying about how to visualize something and start focusing entirely on what you want to say. That shift in mental energy is where the real productivity gain happens. It allows you to spend less time wrestling with PowerPoint alignment tools and more time refining your message, connecting with your audience, and delivering a presentation that actually moves the needle.